项目重构,已发新文章:服务器响应日志处理 – 思行合一 (zzhanzhang.top)
这里也是闲着了,在看日志的时候突发奇想:能不能把日志格式化、可视化、可以的话还要查询ip属地;我知道市面上有很多的日志查看工具,页面漂亮,功能繁多,但无非都要钱了,特别是ip查询api,明码标价,虽然也有免费的,但是效果是不如人意的,所以,我要用我毕生所学来完成这些!
项目已上传到github:ShaogHong/python_Log_format: (github.com)
在老师那里要来了一个免费的api:https://qifu.baidu.com/ip/geo/v1/district?ip= 能查的信息还挺多的:
{
  "code": "Success",
  "data": {
      "continent": "亚洲",
      "country": "印度尼西亚",
      "zipcode": "",
      "timezone": "UTC+7",
      "accuracy": "省",
      "owner": "Institut Teknologi Del",
      "isp": "Institut Teknologi Del",
      "source": "数据挖掘",
      "areacode": "ID",
      "adcode": "",
      "asnumber": "142367",
      "lat": "2.110200",
      "lng": "99.541564",
      "radius": "",
      "prov": "北苏门答腊省",
      "city": "",
      "district": ""
  },
  "charge": false,
  "msg": "查询成功",
  "ip": "103.167.217.137",
  "coordsys": "WGS84"
  }
处理方法
将日志格式化到mysql数据库或者csv中,先遍历日志有多少条,如果超过了1万条,建议是处理最后1w条,当然也可以选择处理全部,也可以自定义选择从多少行开始处理,最开始在测试的时候处理17万条日志的时候花了2个小时左右;

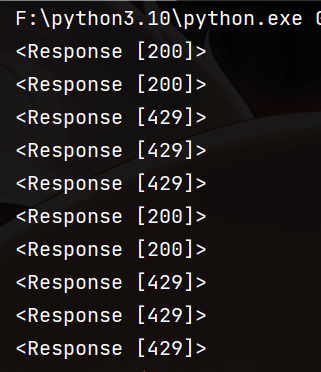
效率是慢了亿点点~但是!这里的日志信息格式化并不花时间,就是在ip信息查询的时候才耗时间,这个api的频率限制地太死了,如果没有设置延时它就查了2条空3条,一百多条之后就全部返回null了,毕竟是免费的就不要太奢求了;(我也承认我菜!技术有限)

处理成csv文件
# coding: UTF-8
"""
@IDE     :PyCharm
@Author  :娄南湘先生
@Date    :2024/3/19,0019 18:53
"""
import csv
import requests
import re
import time as tm
import sys

DEFAULT_API_URL = "https://qifu.baidu.com/ip/geo/v1/district?ip="


def query_ip_location(ip, url_input=None):
    url = url_input if url_input else DEFAULT_API_URL + ip
    try:
        response = requests.get(url)
        if response.status_code == 200:
            data = response.json()
            if data.get("code") == "Success":
                return data["data"]
    except Exception as e:
        print(f"查询 IP 时出错 {ip}: {e}")
    return None


def parse_log_line(line):
    pattern = r'(?P<ip>\d{1,3}\.\d{1,3}\.\d{1,3}\.\d{1,3}).*?\[(?P<time>.*?)\]\s*"(?P<method>\w+)\s*(?P<path>.*?)\s*(?P<protocol>.*?)"\s*(?P<status>\d+)\s*(?P<size>\d+)\s*"(?P<referrer>.*?)"\s*"(?P<user_agent>.*?)"'
    match = re.match(pattern, line)
    if match:
        groups = match.groupdict()
        ip = groups['ip']
        time = groups['time']
        method = groups['method']
        path = groups['protocol'].split()[0]
        protocol = groups['protocol'].split()[-1]
        status = groups['status']
        size = groups['size']
        referrer = groups['referrer']
        user_agent = groups['user_agent']

        return ip, time, method, path, protocol, status, size, referrer, user_agent
    return None


def write_to_csv(log_data, filename):
    headers = ["ip", "大洲", "国家", "城市", "城市编码", "经度", "纬度", "所有者", "运营商", "请求时间", "请求方法",
               "请求行", "请求的资源路径", "HTTP协议版本", "状态码+描述", "响应大小", "引用页", "用户代理信息"]
    with open(filename, mode='w', newline='', encoding='utf-8') as file:
        writer = csv.writer(file)
        writer.writerow(headers)
        writer.writerows(log_data)

def main():
    log_filename = input("把日志文件拖过来:")
    ip_locations = {}
    log_data = []
    insert_values = []

    with open(log_filename, mode='r', encoding='utf-8') as file:
        line_count = sum(1 for _ in file)
        if line_count >= 10000:
            choice = input(
                f"该日志行数超过1W条,共有{line_count}行,是否只处理最后1W条(y/n), 或输入数字从指定行数开始处理: ")
            if choice.lower() == "y":
                file.seek(0)
                lines_to_skip = max(0, line_count - 10000)
                for _ in range(lines_to_skip):
                    next(file)
            elif choice.isdigit():
                start_line = int(choice)
                file.seek(0)
                for _ in range(start_line):
                    next(file)
            else:
                file.seek(0)

        start_time = tm.time()
        loading_symbols = ['| ', '- ', '/ ', '\\ ']
        loading_index = 0
        for idx, line in enumerate(file):
            parsed_line = parse_log_line(line)
            if parsed_line:
                ip, time, method, path, xie_yi, status, size, referrer, user_agent = parsed_line
                if ip not in ip_locations:
                    ip_location = query_ip_location(ip)
                    if ip_location:
                        ip_locations[ip] = ip_location
                else:
                    ip_location = ip_locations[ip]

                if ip_location:
                    entry = [
                        ip,
                        ip_location.get("continent", "null"),
                        ip_location.get("country", "null"),
                        ip_location.get("city", "null"),
                        ip_location.get("areacode", "null"),
                        ip_location.get("lng", "null"),
                        ip_location.get("lat", "null"),
                        ip_location.get("owner", "null"),
                        ip_location.get("isp", "null"),
                        time,
                        method,
                        f"{method} {path} {xie_yi}",
                        path,
                        xie_yi,
                        status + ("部分成功" if 100 <= int(status) < 200 else "成功" if 200 <= int(
                            status) < 300 else "细化请求" if 300 <= int(status) < 400 else "客户端错误" if 400 <= int(
                            status) < 500 else "服务器错误"),
                        size,
                        referrer,
                        user_agent
                    ]

                    insert_values.append(entry)

            sys.stdout.write(f"\r格式化中 {loading_symbols[loading_index]}")
            loading_index = (loading_index + 1) % len(loading_symbols)
            sys.stdout.flush()

            if len(insert_values) == 100:
                log_data.extend(insert_values)
                insert_values = []

        if len(insert_values) > 0:
            log_data.extend(insert_values)

    write_to_csv(log_data, f"{log_filename}已处理.csv")
    end_time = tm.time()
    print(f"\nIP属地查询完成,日志格式化完成,TIME: {end_time - start_time:.1f}S,文件保存在{log_filename}已处理.csv")

if __name__ == "__main__":
    main()
在处理1000条日志信息时所需时间为2分钟左右,处理一万条日志信息的时间(三次测试平均值)为14.5分钟;

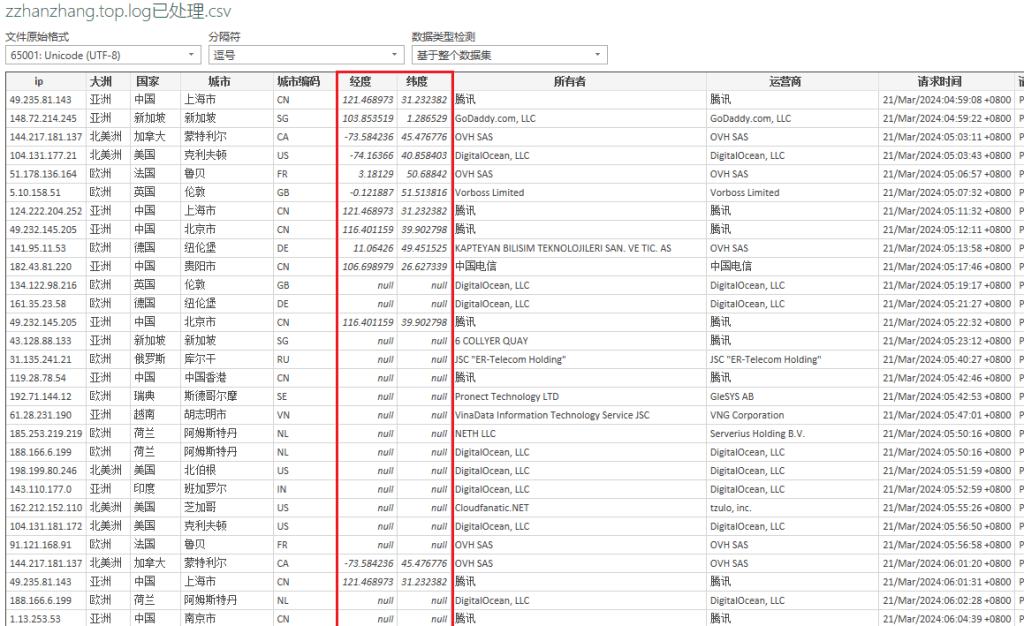
处理结果为:

这里有一个问题:在浏览器中使用api单个ip查询的时候,基本上经纬度是都有的,但是在代码中的每次执行,只有前面几个ip是有经纬度的,后面就隔了十几次查询才有ip的经纬度,原因不明,老师的解释是说:这个api的经纬度查询也是调用了其它的api进行的,也就说:这个api有频率限制,而这个api调用的经纬度查询api也有频率限制,我是懵了,算了,没有就没有吧……
格式化到MySQL数据库中
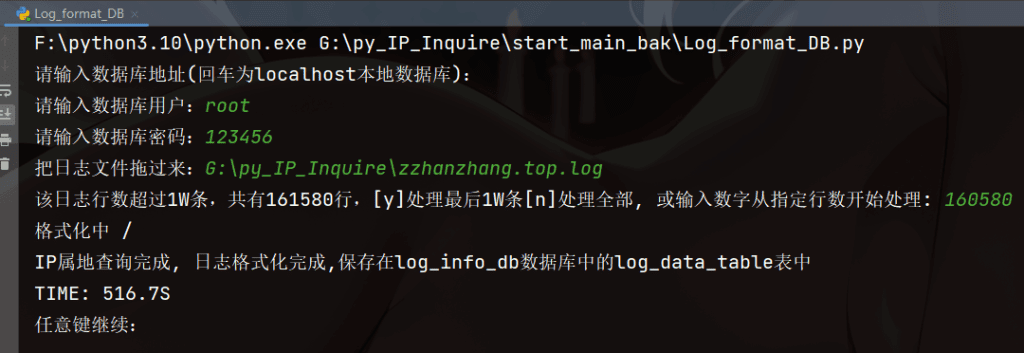
我是想着如果能给别人用的话,那就要尽可能地让人家少手动操作,于是就不需要手动建库建表,只需要连接填入连接信息,运行代码中会自动创建一个”log_info_db”的数据库,在这个数据库下会自动创建一个”log_data_table”表,日志就格式化在这个表中;
import re
import mysql.connector
import requests
import time
import sys
from fake_useragent import UserAgent

mysql_host = input("输入数据库地址(回车为localhost本地数据库):") or "localhost"
mysql_user = input("输入数据库用户:")
mysql_pwd = input("输入数据库密码:")

db_connection = mysql.connector.connect(
    host=mysql_host,
    user=mysql_user,
    password=mysql_pwd,
)

db_cursor = db_connection.cursor()

db_cursor.execute("CREATE DATABASE IF NOT EXISTS log_info_db")
db_cursor.execute("USE log_info_db")

create_table_query = """
CREATE TABLE IF NOT EXISTS log_data_table (
    ip TEXT,
    continent TEXT,
    country TEXT,
    city TEXT,
    city_code TEXT,
    longitude TEXT,
    latitude TEXT,
    owner TEXT,
    isp TEXT,
    request_time TEXT,
    request_line LONGTEXT,
    http_version TEXT,
    status_code TEXT,
    response_size TEXT,
    referer LONGTEXT,
    user_agent LONGTEXT
)
"""
db_cursor.execute(create_table_query)


def query_ip_location(ip):
    retry_count = 0
    while retry_count < 3:
        try:
            response = requests.get(f"https://qifu.baidu.com/ip/geo/v1/district?ip={ip}",
                                    headers={'User-Agent': ua.random},
                                    timeout=3)
            if response.status_code == 200:
                data = response.json().get('data', {})
                # print(data)
                if all(key in data for key in
                       ['continent', 'country', 'prov', 'city', 'areacode', 'lng', 'lat', 'owner', 'isp']):
                    return (
                        data.get('continent', 'null'),
                        data.get('country', 'null'),
                        f"{data.get('prov', 'null')} {data.get('city', 'null')}" if data.get('prov') or data.get(
                            'city') else 'null',
                        data.get('areacode', 'null'),
                        data.get('lng', 'null'),
                        data.get('lat', 'null'),
                        data.get('owner', 'null'),
                        data.get('isp', 'null')
                    )
                else:
                    # print(f"{ip}数据不完整")
                    retry_count += 1
            elif response.status_code == 429:
                # print(f"429 之后重试 {retry_count * 0.08} 秒。。。")
                time.sleep(retry_count * 0.08)
                retry_count += 1
            else:
                # print(f"{response.status_code}")
                return ('null', 'null', 'null', 'null', 'null', 'null', 'null', 'null')
        except Exception as e:
            # print(f"{ip}: {e}")
            return ('null', 'null', 'null', 'null', 'null', 'null', 'null', 'null')

    return ('null', 'null', 'null', 'null', 'null', 'null', 'null', 'null')


log_file_path = input("把日志文件拖过来:")
# log_file_path = "../zzhanzhang.top.log"
log_entries = []

with open(log_file_path, 'r') as file:
    lines = file.readlines()
    line_count = len(lines)

    if line_count >= 10000:
        choice = input(
            f"该日志行数超过1W条,共有{line_count}行,[y]处理最后1W条[n]处理全部, 或输入数字从指定行数开始处理: ")
        if choice.lower() == "y":
            lines = lines[-10000:]
        elif choice.isdigit():
            start_line = int(choice)
            lines = lines[max(0, start_line - 1):]

    for line in lines:
        match = re.match(r'^(\S+) - - \[(.+)\] "(\S+) (\S+) (\S+)" (\d+) (\d+) "([^"]+)" "([^"]+)"$', line)
        if match:
            ip, request_time, request_method, request_path, http_version, status_code, response_size, referer, user_agent = match.groups()
            status_code_description = (
                "部分成功" if 100 <= int(status_code) < 200 else
                "成功" if 200 <= int(status_code) < 300 else
                "细化请求" if 300 <= int(status_code) < 400 else
                "客户端错误" if 400 <= int(status_code) < 500 else
                "服务器错误"
            )
            log_entries.append({
                'ip': ip,
                'request_time': request_time,
                'request_line': f"{request_method} {request_path}",
                'http_version': http_version,
                'status_code': status_code + status_code_description,
                'response_size': response_size,
                'referer': referer,
                'user_agent': user_agent
            })

start_time = time.time()
total_entries = len(log_entries)
loading_symbols = ['| ', '- ', '/ ', '\\ ']
loading_index = 0
ua = UserAgent()
batch_size = 100  # 批量插入的大小
insert_values = []  # 存储列表

for index, entry in enumerate(log_entries):
    ip = entry['ip']
    continent, country, city, city_code, longitude, latitude, owner, isp = query_ip_location(ip)
    insert_values.append((
        ip, continent, country, city, city_code, longitude, latitude, owner, isp, entry['request_time'],
        entry['request_line'], entry['http_version'], entry['status_code'],
        entry['response_size'], entry['referer'], entry['user_agent']
    ))

    sys.stdout.write(f"\r格式化中 {loading_symbols[loading_index]}")
    sys.stdout.flush()
    loading_index = (loading_index + 1) % len(loading_symbols)

    if len(insert_values) == batch_size:
        # 执行批量插入
        insert_query = """
        INSERT INTO log_data_table (ip, continent, country, city, city_code, longitude, latitude, owner, isp, request_time,
                              request_line, http_version, status_code, response_size, referer, user_agent)
        VALUES (%s, %s, %s, %s, %s, %s, %s, %s, %s, %s, %s, %s, %s, %s, %s, %s)
        """
        db_cursor.executemany(insert_query, insert_values)
        db_connection.commit()
        insert_values = []

# 最后一次插入
if len(insert_values) > 0:
    insert_query = """
    INSERT INTO log_data_table (ip, continent, country, city, city_code, longitude, latitude, owner, isp, request_time,
                          request_line, http_version, status_code, response_size, referer, user_agent)
    VALUES (%s, %s, %s, %s, %s, %s, %s, %s, %s, %s, %s, %s, %s, %s, %s, %s)
    """
    db_cursor.executemany(insert_query, insert_values)
    db_connection.commit()

end_time = time.time()
db_cursor.close()
db_connection.close()

print(
    f"\nIP属地查询完成, 日志格式化完成,保存在log_info_db数据库中的log_data_table表中\nTIME: {end_time - start_time:.1f}S")
input("任意键继续:")
在处理1000条日志信息的结果中,依旧存在经纬度只有少部分存在的问题,处理时间为:8分钟左右,处理1万条(三次测试平均值)为54.6分钟,这个时间真的很不满意,如果真要用来处理大批量日志那还是选择处理成csv得了,那个要快很多,再导入到数据库中,当然之后有学到好办法我会改进;

功能区块
简简单单的几个功能,只是就几个重要信息作统计而已;
1_ip_count_csv.py
根据ip来处理,得到数据:”排名,ip,country,city,owner,数量,百分占比”
可自定义选择返回前XX名的ip信息,但是日志ip没有被查询的话,country和city和owner就不会返回数据,
统计后的数据会保存到ip统计.csv中;
import csv
import mysql.connector

mysql_host = input("数据库地址(回车为localhost本地数据库):") or "localhost"
mysql_user = input("数据库用户:")
mysql_pwd = input("数据库密码:")
mysql_db = input("数据库名或者回车使用默认(Log_format_DB.py自动创建的库):") or "log_info_db"

connection = mysql.connector.connect(
    host=mysql_host,
    user=mysql_user,
    password=mysql_pwd,
    database=mysql_db
)
cursor = connection.cursor()
log_info_table = input("输入表名或者回车使用默认(为Log_format_DB.py自动创建的表):") or "log_data_table"
ip_rank = input("输入需要排行数/回车排出前十:") or 10

query = f"SELECT ip, country, city, owner, COUNT(*) AS count FROM {log_info_table} GROUP BY ip ORDER BY count DESC LIMIT {ip_rank}"
cursor.execute(query)

results = cursor.fetchall()

cursor.close()
connection.close()

with open(f'{log_info_table}的ip统计.csv', 'w', newline='') as csvfile:
    writer = csv.writer(csvfile)
    writer.writerow(['排名', 'ip', 'country', 'city', 'owner', '数量', '百分比'])

    total_count = sum(row[4] for row in results)

    for index, row in enumerate(results, 1):
        ip, country, city, owner, count = row
        percentage = "{:.2f}".format((count / total_count) * 100)
        writer.writerow([index, ip, country, city, owner, count, percentage])
input(f"{log_info_table}的ip统计.csv文件已成功生成,任意键退出")
2_continent_count_txt.py
根据continent字段来统计来自各个大洲ip的数量和百分占比;
import mysql.connector

mysql_host = input("数据库地址(回车为localhost本地数据库):") or "localhost"
mysql_user = input("数据库用户:")
mysql_pwd = input("数据库密码:")
mysql_db = input("数据库名或者回车使用默认(Log_format_DB.py自动创建的库):") or "log_info_db"

connection = mysql.connector.connect(
    host=mysql_host,
    user=mysql_user,
    password=mysql_pwd,
    database=mysql_db
)

cursor = connection.cursor()
log_info_table = input("输入表名或者回车使用默认(为Log_format_DB.py自动创建的表):") or "log_data_table"

query = f"SELECT continent, COUNT(*) AS count FROM {log_info_table} WHERE continent IS NOT NULL GROUP BY continent"
cursor.execute(query)

results = cursor.fetchall()

cursor.close()
connection.close()

continents = [row[0] for row in results]
counts = [row[1] for row in results]

total_count = sum(counts)
percentages = [(count / total_count) * 100 for count in counts]

lines = [f"{continent} {count} {percentage:.2f}%" for continent, count, percentage in
         zip(continents, counts, percentages)]
output = '\n'.join(lines)

with open(f'{log_info_table}大洲统计.txt', 'w') as file:
    file.write(output)
input(f"{log_info_table}的大洲统计.txt文件已成功生成,任意键退出")
3_country_count.py
就country字段统计国家信息,自定义前几名(默认值前十)绘制柱状图显示出来;
import matplotlib.pyplot as plt
import mysql.connector

mysql_host = input("数据库地址(回车为localhost本地数据库):") or "localhost"
mysql_user = input("数据库用户:")
mysql_pwd = input("数据库密码:")
mysql_db = input("数据库名或者回车使用默认(Log_format_DB.py自动创建的库):") or "log_info_db"

connection = mysql.connector.connect(
    host=mysql_host,
    user=mysql_user,
    password=mysql_pwd,
    database=mysql_db
)

cursor = connection.cursor()
log_info_table = input("输入表名或者回车使用默认(为Log_format_DB.py自动创建的表):") or "log_data_table"
country_rank = input("输入需要排行数/回车排出前十:") or 10

query = f"SELECT country, COUNT(*) AS count FROM {log_info_table} WHERE country IS NOT NULL GROUP BY country ORDER BY count DESC LIMIT {country_rank}"
cursor.execute(query)

results = cursor.fetchall()

cursor.close()
connection.close()

countries = [row[0] for row in results]
counts = [row[1] for row in results]

total_count = sum(counts)
percentages = [(count / total_count) * 100 for count in counts]

plt.rcParams['font.sans-serif'] = ['SimHei']
fig, ax = plt.subplots(figsize=(10, 6))
colors = ['red', 'green', 'blue', 'yellow', 'purple', 'orange', 'cyan', 'magenta', 'lime', 'pink']
bars = ax.bar(range(len(countries)), counts, color=colors)

for i, bar in enumerate(bars):
    x = bar.get_x() + bar.get_width() / 2
    y = bar.get_height()
    percentage = percentages[i]
    ax.text(x, y, f"{countries[i]}\n{counts[i]}\n{percentage:.2f}%", ha='center', va='bottom')

ax.set_xticks(range(len(countries)))
ax.set_xticklabels(countries, rotation=45, ha='right')

plt.title('国家统计')
plt.xlabel('国家')
plt.ylabel('数量')

plt.savefig(f'{log_info_table}的国家统计.png', dpi=300, bbox_inches='tight')

plt.show()
4_city_count.py
根据city字段来统计城市信息,自定义前几名(默认值前十)的城市来绘制柱状图;
import matplotlib.pyplot as plt
import mysql.connector

mysql_host = input("数据库地址(回车为localhost本地数据库):") or "localhost"
mysql_user = input("数据库用户:")
mysql_pwd = input("数据库密码:")
mysql_db = input("数据库名或者回车使用默认(Log_format_DB.py自动创建的库):") or "log_info_db"

connection = mysql.connector.connect(
    host=mysql_host,
    user=mysql_user,
    password=mysql_pwd,
    database=mysql_db
)

cursor = connection.cursor()
log_info_table = input("输入表名或者回车使用默认(为Log_format_DB.py自动创建的表):") or "log_data_table"
city_rank = input("输入需要排行数/回车排出前十:") or 10

query = f"SELECT city, COUNT(*) AS count FROM {log_info_table} WHERE city IS NOT NULL GROUP BY city ORDER BY count DESC LIMIT {city_rank}"
cursor.execute(query)

results = cursor.fetchall()

cursor.close()
connection.close()

cities = [row[0] for row in results]
counts = [row[1] for row in results]

total_count = sum(counts)
percentages = [(count / total_count) * 100 for count in counts]

plt.rcParams['font.sans-serif'] = ['SimHei']

fig, ax = plt.subplots(figsize=(10, 8))
colors = ['red', 'green', 'blue', 'yellow', 'purple', 'orange', 'cyan', 'magenta', 'lime', 'pink',
          'lightblue', 'lightgreen', 'lightcoral', 'lightsalmon', 'lightpink', 'lightgray', 'lightyellow',
          'lightskyblue', 'lightseagreen', 'lightsteelblue']
bars = ax.barh(range(len(cities)), counts, color=colors)

for i, bar in enumerate(bars):
    x = bar.get_width()
    y = bar.get_y() + bar.get_height() / 2
    percentage = percentages[i]
    ax.text(x, y, f"{counts[i]}\n{percentage:.2f}%", ha='left', va='center')

ax.set_yticks(range(len(cities)))
ax.set_yticklabels(cities)

plt.title('地区统计')
plt.xlabel('数量')
plt.ylabel('地区')

plt.savefig(f'{log_info_table}的地区统计.png', dpi=300, bbox_inches='tight')

plt.show()
5_owner_count_txt.py
就owner字段的ip所有者来统计信息并排序(自定义前几名,默认值前十);
import mysql.connector
import csv

mysql_host = input("数据库地址(回车为localhost本地数据库):") or "localhost"
mysql_user = input("数据库用户:")
mysql_pwd = input("数据库密码:")
mysql_db = input("数据库名或者回车使用默认(Log_format_DB.py自动创建的库):") or "log_info_db"

connection = mysql.connector.connect(
    host=mysql_host,
    user=mysql_user,
    password=mysql_pwd,
    database=mysql_db
)

cursor = connection.cursor()
log_info_table = input("输入表名或者回车使用默认(为Log_format_DB.py自动创建的表):") or "log_data_table"
owner_rank = input("输入需要排行数/回车排出前十:") or 10

query = f"SELECT owner, COUNT(*) AS count FROM {log_info_table} WHERE owner IS NOT NULL GROUP BY owner ORDER BY count DESC LIMIT {owner_rank}"
cursor.execute(query)

results = cursor.fetchall()

cursor.close()
connection.close()

with open(f'{log_info_table}的所有者统计.csv', 'w', newline='') as file:
    writer = csv.writer(file)
    writer.writerow(['排名', 'owner', '数量', '百分比'])

    total_count = sum(row[1] for row in results)

    for i, row in enumerate(results, 1):
        owner = row[0]
        count = row[1]
        percentage = (count / total_count) * 100
        writer.writerow([i, owner, count, f'{percentage:.2f}%'])
    input(f"文件已经在{log_info_table}的所有者统计.csv中,按任意键退出")
6_request_lint_count.py
根据request_count字段来统计请求行,自定义排名前几,自动义是否统计访问这个链接最多的owne信息;
import mysql.connector
import pandas as pd

def connect_to_database(host, user, password, database):
    try:
        connection = mysql.connector.connect(
            host=host,
            user=user,
            password=password,
            database=database
        )
        return connection
    except mysql.connector.Error as err:
        print(f"连接数据库失败: {err}")
        return None


def execute_query(connection, query):
    try:
        cursor = connection.cursor()
        cursor.execute(query)
        columns = cursor.column_names
        data = cursor.fetchall()
        df = pd.DataFrame(data, columns=columns)
        cursor.close()
        return df
    except mysql.connector.Error as err:
        print(f"执行查询失败: {err}")
        return None
def save_to_csv(df, filename):
    try:
        df.to_csv(filename, index=False)
        input(f"结果已保存为 {filename}")
    except Exception as e:
        print(f"保存CSV文件失败: {e}")


def main():
    mysql_host = input("数据库地址(回车为localhost本地数据库):") or "localhost"
    mysql_user = input("数据库用户:")
    mysql_pwd = input("数据库密码:")
    mysql_db = input("数据库名或者回车使用默认(Log_format_DB.py自动创建的库):") or "log_info_db"
    log_info_table = input("输入表名或者回车使用默认(为Log_format_DB.py自动创建的表):") or "log_data_table"
    request_rank = input("输入需要排行数/回车排出前十:") or 10
    if_owner = input("是否关联owner(y/n):")

    if if_owner.lower() == "y":
        query = f"""
        SELECT request_line, GROUP_CONCAT(owner SEPARATOR ', ') AS owners, COUNT(*) AS count,
               COUNT(*) * 100.0 / (SELECT COUNT(*) FROM {log_info_table}) AS percentage
        FROM {log_info_table}
        GROUP BY request_line
        ORDER BY count DESC
        LIMIT {request_rank}
        """
    else:
        query = f"""
        SELECT request_line, COUNT(*) AS count,
               COUNT(*) * 100.0 / (SELECT COUNT(*) FROM {log_info_table}) AS percentage
        FROM {log_info_table}
        GROUP BY request_line
        ORDER BY count DESC
        LIMIT {request_rank}
        """

    connection = connect_to_database(mysql_host, mysql_user, mysql_pwd, mysql_db)
    if connection is None:
        return
    df = execute_query(connection, query)
    if df is None:
        connection.close()
        return
    filename = f"{log_info_table}的request_line请求行统计.csv"
    save_to_csv(df, filename)
    connection.close()


if __name__ == "__main__":
    main()
7_user_agent_Bot_csv.py
就user_agent字段统计用户代理的搜索引擎&机器人信息;
# coding: UTF-8
"""
@IDE     :PyCharm
@Author  :娄南湘先生
@Date    :2024/3/22,0022 15:16
"""
import csv
from collections import defaultdict
import mysql.connector

# 机器人名列表
robots = [
    "Googlebot", "Bingbot", "Yahoo", "Slurp", "Baiduspider", "YandexBot", "DuckDuckBot",
    "Sogou web spider", "Exabot", "FacebookBot", "Twitterbot", "LinkedInBot", "Pinterestbot",
    "Applebot", "MJ12bot", "AhrefsBot", "SemrushBot", "RamblerBot", "DotBot", "BingPreview",
    "YandexImages", "Screaming Frog SEO Spider", "SeznamBot", "Embedly", "Slackbot", "TelegramBot",
    "WhatsApp", "Discordbot", "360Spider", "MSNBOT", "NaverBot", "Gigabot", "YandexMobileBot",
    "FacebookExternalHit", "Pinterest", "Ask Jeeves/Teoma", "Alexa Crawler",
    "YodaoBot", "ia_archiver",
    "CoccocBot", "Vsekorakhiver", "voilabot", "mail.ru_bot", "NZZ3", "TurnitinBot",
    "ScopeusBot", "GrapeshotCrawler", "Curalab", "SiteBot", "SitebeamBot", "SEOstats Crawler",
    "Butterfly Collector", "Genieo Web filter",
    "InfoSeek Robot 1.0", "W3 SiteSearch Crawler", "ZoomSpider.net", "Ezooms", "Teoma",
    "Scooter", "WebAlta Crawler", "Gigabot", "Alexa Media Crawler",
    "MojeekBot", "BLEXBot", "YandexSomething", "CrawllyBot",
    "Wotbox", "SiteExplorer.com",
    "sogou spider", "sogou news spider", "sogou orion spider", "sogou pic spider", "sogou video spider"
]

mysql_host = input("数据库地址(回车为localhost本地数据库):") or "localhost"
mysql_user = input("数据库用户:")
mysql_pwd = input("数据库密码:")
mysql_db = input("数据库名或者回车使用默认(Log_format_DB.py自动创建的库):") or "log_info_db"

connection = mysql.connector.connect(
    host=mysql_host,
    user=mysql_user,
    password=mysql_pwd,
    database=mysql_db
)

cursor = connection.cursor()
log_info_table = input("输入表名或者回车使用默认(为Log_format_DB.py自动创建的表):") or "log_data_table"

query = f"SELECT user_agent, COUNT(*) AS count FROM {log_info_table} GROUP BY user_agent"
cursor.execute(query)

results = cursor.fetchall()

cursor.close()
connection.close()

robot_data = defaultdict(int)
total_count = 0

for row in results:
    user_agent = row[0]
    count = row[1]
    total_count += count

    found_robots = []
    for robot in robots:
        if robot.lower() in user_agent.lower():
            found_robots.append(robot)

    if found_robots:
        for robot in found_robots:
            robot_data[robot] += count

processed_data = []
for robot in robots:
    count = robot_data[robot]
    percentage = (count / total_count) * 100
    processed_data.append((robot, count, f"{percentage:.4f}%"))

processed_data.sort(key=lambda x: x[1], reverse=True)

with open(f'{log_info_table}的user_agent机器人统计.csv', 'w', newline='') as file:
    writer = csv.writer(file)
    writer.writerow(['排名', '机器人名', '数量', '百分比'])

    for i, row in enumerate(processed_data, 1):
        robot = row[0]
        count = row[1]
        percentage = row[2]
        writer.writerow([i, robot, count, percentage])
input(f"文件{log_info_table}的user_agent机器人统计.csv已生成")
8_user_agent_browser_csv.py
就user_agent字段统计用户代理的浏览器信息;
import re
import mysql.connector
import csv
from collections import defaultdict

browsers = [
    "Chrome", "Safari", "Firefox", "Internet Explorer", "Edge", "Edg", "Opera", "Brave", "BIDUBrowser",
    "UCBrowser", "SamsungBrowser", "Maxthon", "Netscape", "Konqueror", "SeaMonkey", "Camino", "MSIE",
    "PaleMoon", "Waterfox", "Vivaldi", "Avant Browser", "Yandex", "Epic Privacy Browser", "Torch",
    "SlimBrowser", "Midori", "Dolphin", "Puffin", "Silk", "BlackBerry", "IE Mobile", "Android Browser",
    "Chrome Mobile", "Opera Mini", "UCWEB", "QQBrowser", "QQ", "Tor Browser",
    "Comodo Dragon", "Sogou Explorer", "360 Browser", "Baidu Browser", "Samsung Internet", "Opera Coast",
    "Opera GX", "Brave Mobile", "Firefox Focus", "Firefox Reality", "Microsoft Internet Explorer",
    "Microsoft Edge Mobile", "Chromium", "Seamonkey", "K-Meleon", "Avast Secure Browser", "Bitwarden Authenticator",
    "Brave Shields", "Brave Rewards", "CentBrowser", "Coc Coc", "Comodo IceDragon", "Disruptor Browser",
    "GreenBrowser", "Iridium Browser", "K-Ninja", "Kiwi Browser", "Lunascape", "Maxthon Cloud Browser",
    "Orbitum", "QupZilla", "Slimjet", "SRWare Iron", "Torch Browser", "UCWeb Browser", "Vivaldi Snapshot",
    "Xombrero", "Opera GX Gaming Browser", "Opera Touch", "Brave Browser for Android", "Firefox for Android",
    "Chrome for Android", "Edge for Android", "Samsung Internet for Android", "UC Browser for Android",
    "QQ Browser for Android", "Brave Browser for iOS", "Firefox for iOS", "Safari for iOS", "Opera for iOS",
    "Opera Coast for iOS", "Puffin Browser", "Dolphin Browser", "CM Browser", "Flynx Browser", "Ghostery Browser",
    "Maxthon Browser", "Opera Mini for Windows", "Perfect Browser", "Photon Browser"
]

mysql_host = input("数据库地址(回车为localhost本地数据库):") or "localhost"
mysql_user = input("数据库用户:")
mysql_pwd = input("数据库密码:")
mysql_db = input("数据库名或者回车使用默认(Log_format_DB.py自动创建的库):") or "log_info_db"

connection = mysql.connector.connect(
    host=mysql_host,
    user=mysql_user,
    password=mysql_pwd,
    database=mysql_db
)

cursor = connection.cursor()
log_info_table = input("输入表名或者回车使用默认(为Log_format_DB.py自动创建的表):") or "log_data_table"

query = f"SELECT user_agent, COUNT(*) AS count FROM {log_info_table} GROUP BY user_agent"
cursor.execute(query)

results = cursor.fetchall()

cursor.close()
connection.close()

browser_data = defaultdict(int)
total_count = 0

for row in results:
    user_agent = row[0]
    count = row[1]
    total_count += count

    found_browsers = []
    for browser in browsers:
        if re.search(r'\b' + re.escape(browser) + r'\b', user_agent, flags=re.IGNORECASE):
            found_browsers.append(browser)

    if found_browsers:
        for browser in found_browsers:
            browser_data[browser] += count


processed_data = []
for browser in browsers:
    count = browser_data[browser]
    percentage = (count / total_count) * 100
    processed_data.append((browser, count, f"{percentage:.4f}%"))


processed_data.sort(key=lambda x: x[1], reverse=True)

with open(f'{log_info_table}的user_agent浏览器统计.csv', 'w', newline='') as file:
    writer = csv.writer(file)
    writer.writerow(['排名', '浏览器名', '数量', '百分比'])

    for i, row in enumerate(processed_data, 1):
        browser = row[0]
        count = row[1]
        percentage = row[2]
        writer.writerow([i, browser, count, percentage])
input(f"文件{log_info_table}的user_agent浏览器统计.csv已生成")
9_user_agent_system.py
统计user_agent中的系统信息;
import csv
from collections import defaultdict
import mysql.connector
systems = ['AIX', 'Alpine Linux', 'AmigaOS', 'Android', 'Android Auto', 'Android Go',
           'Android Pie', 'Android Q', 'Android R', 'Android S', 'Android TV', 'Android Wear',
           'Arch Linux', 'Bada', 'BeOS', 'BlackBerry', 'BlackBerry OS', 'Bodhi Linux', 'CentOS',
           'Chrome OS', 'Debian', 'Elementary OS', 'Fedora', 'Firefox OS', 'FreeBSD', 'Gentoo',
           'HP-UX', 'Haiku', 'IRIX', 'KDE neon', 'KaOS', 'KaiOS', 'KaiOSWindows', 'Kali Linux',
           'Kindle', 'Kubuntu', 'Linux', 'Lubuntu', 'MX Linux',  'Mac OS X', 'Mac Os',
           'Macintosh', 'Manjaro', 'Mint', 'MorphOS', 'NetBSD', 'Nintendo', 'Nintendo Wii',
           'Nokia', 'OS/2', 'OpenBSD', 'Palm OS', 'Parrot OS', 'PlayStation', 'Q4OS', 'QNX',
           'RISC OS', 'Raspberry Pi OS', 'Red Hat', 'Roku', 'SUSE', 'Sailfish OS', 'SmartTV',
           'Solaris', 'Solus', 'SolusOS', 'SteamOS', 'SunOS', 'Symbian', 'Tails', 'Tizen',
           'Trisquel', 'Ubuntu', 'Unix', 'Void Linux', 'WebTV',  'Windows 10 Mobile',
           'Windows 11', 'Windows 2000', 'Windows 3.11', 'Windows 7', 'Windows 8', 'Windows 8.1',
           'Windows 95', 'Windows 98', 'Windows CE', 'Windows ME', 'Windows Millennium',
           'Windows Mobile',  'Windows NT 10.0', 'Windows NT 3.1', 'Windows NT 3.5',
           'Windows NT 3.51', 'Windows NT 4.0', 'Windows NT 5.0', 'Windows NT 5.1', 'Windows NT 5.2',
           'Windows NT 6.0', 'Windows NT 6.1', 'Windows NT 6.2', 'Windows NT 6.3', 'Windows Phone',
           'Windows RT', 'Windows Server', 'Windows Vista', 'Windows XP', 'Xbox', 'Xubuntu', 'Zorin OS',
           'iOS', 'iPadOS', 'macOS', 'macOS Big Sur', 'macOS Catalina', 'macOS High Sierra', 'macOS Mojave',
           'macOS Monterey', 'macOS Sierra', 'macOS Ventura', 'openSUSE', 'tvOS', 'watchOS', 'webOS']

mysql_host = input("数据库地址(回车为localhost本地数据库):") or "localhost"
mysql_user = input("数据库用户:")
mysql_pwd = input("数据库密码:")
mysql_db = input("数据库名或者回车使用默认(Log_format_DB.py自动创建的库):") or "log_info_db"

connection = mysql.connector.connect(
    host=mysql_host,
    user=mysql_user,
    password=mysql_pwd,
    database=mysql_db
)

cursor = connection.cursor()
log_info_table = input("输入表名或者回车使用默认(为Log_format_DB.py自动创建的表):") or "log_data_table"

query = f"SELECT user_agent, COUNT(*) AS count FROM {log_info_table} GROUP BY user_agent"
cursor.execute(query)

results = cursor.fetchall()

cursor.close()
connection.close()

system_data = defaultdict(int)
total_count = 0

for row in results:
    user_agent = row[0]
    count = row[1]
    total_count += count

    found_systems = []
    for system in systems:
        if system.lower() in user_agent.lower():
            found_systems.append(system)

    if found_systems:
        for system in found_systems:
            system_data[system] += count

processed_data = []
for system in systems:
    count = system_data[system]
    percentage = (count / total_count) * 100
    processed_data.append((system, count, f"{percentage:.3f}%"))


processed_data.sort(key=lambda x: x[1], reverse=True)


with open(f'{log_info_table}的user_agent系统统计.csv', 'w', newline='') as file:
    writer = csv.writer(file)
    writer.writerow(['排名', '系统名', '数量', '百分比'])

    for i, row in enumerate(processed_data, 1):
        system = row[0]
        count = row[1]
        percentage = row[2]
        writer.writerow([i, system, count, percentage])
input(f"文件{log_info_table}的user_agent系统统计.csv已生成")
10_status_code_system_png.py
统计status_code字段中的响状态,绘制成饼图;
import pandas as pd
import matplotlib.pyplot as plt
import mysql.connector
from sqlalchemy import create_engine

mysql_host = input("数据库地址(回车为localhost本地数据库):") or "localhost"
mysql_user = input("数据库用户:")
mysql_pwd = input("数据库密码:")
mysql_db = input("数据库名或者回车使用默认(Log_format_DB.py自动创建的库):") or "log_info_db"

connection = mysql.connector.connect(
    host=mysql_host,
    user=mysql_user,
    password=mysql_pwd,
    database=mysql_db
)

# SQLAlchemy连接
engine = create_engine(f"mysql+mysqlconnector://{mysql_user}:{mysql_pwd}@{mysql_host}/{mysql_db}")

log_info_table = input("输入表名或者回车使用默认(为Log_format_DB.py自动创建的表):") or "log_data_table"
query = f"SELECT * FROM {log_info_table}"
data = pd.read_sql(query, con=engine)

status_counts = data['status_code'].value_counts()

total_count = status_counts.sum()
percentage_threshold = 0.01  # 百分比阈值
other_percentage = 0.0
other_count = 0
filtered_counts = status_counts[status_counts / total_count >= percentage_threshold]

if len(filtered_counts) < len(status_counts):
    other_count = status_counts[status_counts / total_count < percentage_threshold].sum()
    other_percentage = other_count / total_count
    filtered_counts['其他'] = other_count

plt.rcParams['font.sans-serif'] = ['SimHei']
plt.figure(figsize=(8, 6))
plt.pie(filtered_counts, labels=filtered_counts.index,
        autopct=lambda p: f'{p:.2f}% ({int(round(p * total_count / 100))})')
plt.title('响应状态统计')

plt.savefig(f'{log_info_table}的响应状态统计.png')
plt.show()
start_main
这里.py的文件太多了,要执行某一个功能的时候难找;于是写了start_main.py统一各个命令来执行各个文件;
import subprocess
print("""Z站长日志处理工具1.0 感谢您的使用,希望能够帮到您!\n网址:https://zzhanzhang.top 作者:娄南湘先生""")

options = {
    "l1": "Log_format_csv.py",
    "l2": "Log_format_DB.py",
    "1": "1_ip_count_csv.py",
    "2": "2_count_cont_txt.py",
    "3": "3_country_count.py",
    "4": "4_city_count.py",
    "5": "5_owner_count_txt.py",
    "6": "6_request_lint_count.py",
    "7": "7_user_agent_Bot_csv.py",
    "8": "8_user_agent_browser_csv.py",
    "9": "9_user_agent_system.py",
    "10": "10_status_code_png.py",
}

while True:
    print("[l1]格式化日志为csv")
    print("[l2]格式化日志为mysql数据表")
    print("[1]ip统计排行")
    print("[2]大洲统计排行")
    print("[3]国家统计排行")
    print("[4]城市统计排行")
    print("[5]ip所有者统计排行")
    print("[6]请求行统计排行")
    print("[7]户代理信息浏览器统计")
    print("[8]用户代理信息机器人统计")
    print("[9]用户代理信息系统统计")
    print("[10]状态码统计")
    print("[q]退出")
    choice = input("输入你的选择:")
    if choice == "q" or choice == "Q":
        break
    if choice not in options:
        print("无效的选择,重新输入。")
        continue
    script_name = options[choice]
    try:
        subprocess.run(["python", script_name])
    except FileNotFoundError as e:
        print("脚本文件不存在:{}".format(e))
    except subprocess.SubprocessError as e:
        print("执行脚本文件时出现错误:{}".format(e))
问:为什么不封装在函数里,留这么多冗余代码?
答:一、在当初打算做这个的时候,我就是一个一个需求来做的,就没有想着要复用某些代码,再一个:我想到如果人家会用这个(虽然不大可能)他/她/它可能会把csv导入到其它的库和表中,所以每个需求中的库和表选择就留下了,他/她/它可以只用这一个.py;而不需要弄整个项目;
二、就是单纯的懒,冗余就冗余嘛,又不是不能用,看得懂得用不着,看不懂得不知道;
